The Roll20 Team
The Orr Group Industry Report explores trends within the tabletop gaming industry with a focus on the online tabletop community.
Created in 2014, the Orr Report has always aimed to go beyond the topic of “what games have sold recently” and really centralize the focus on what games people are continuing to play and enjoy on an ongoing basis. Everyone from players to publishers can get a bird’s eye view for the usage and popularity of different systems and identify trends for tabletop as a whole. After a hiatus, we are now returning with a new and significantly improved report that offers richer insights.
What’s new in the Orr Report?
The Orr Report has made a shift in how we collect data. In previous years, our collection method was solely based on user selection data. We have now added a new process that also looks at character sheet usage from all 4 million+ Roll20 accounts. This provides us with data that is more broadly representative, accurate, and integrated into our systems.Whether you are familiar with the Orr Report already and have been patiently awaiting the next one or this is your first encounter, we’re confident that our improved data selection adds more value to the results than ever before.
The charts below provide a quick glance at game system frequency in Q2 2019, but as always we’ll have the full breakdown for each game system on Roll20 at the end of the report. Let’s have a look!

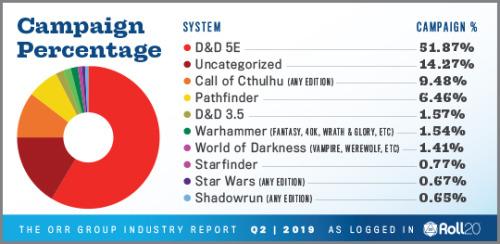
_Campaign Percentage: How many Roll20 campaigns use this game system. _

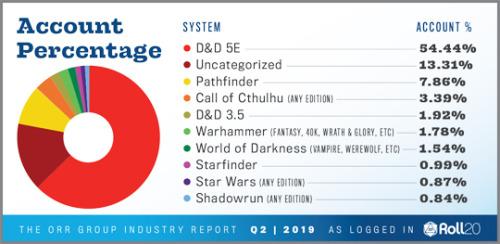
Account Percentage: How many Roll20 users play this game system.
Only games with at least one hour of playtime are counted in these results.
Dungeons & Dragons Fifth Edition (D&D 5E) leads across both categories with the highest percentage of both campaigns and accounts in Roll20. We’ll come back to discuss Uncategorized games in a moment, but first we want to look at the interesting twist in the results for the next unified game system! If you look at Account Percentage, Pathfinder comes in a strong second, meaning more people play Pathfinder than anything else except D&D 5E. Look over at Campaign Percentage, however, and you’ll find that Call of Cthulhu has stretched up its tendrils to seize a surprise second place for the overall number of games played in any system.
We got curious about how that happened and decided to dig further into our data for Call of Cthulhu games. We found that they have an average playtime of 11.9 hours, compared to 40 hour average game times for other systems on these charts. This might suggest that Call of Cthulhu GMs enjoy running more short games with small groups, or simply that you’re all descending into madness very quickly and your GMs are leaving you to die.
Now let’s look at that big slice of Uncategorized games. This is a new grouping made possible by our updated data collection which looks at all usage on Roll20, including this group of free spirits who use custom sheets, have no listed system, or eschew character sheets entirely. The size of this group suggests that quite a healthy percentage of tabletop players want to customize their games, whether it’s taking a familiar system and morphing it to suit their needs or building a homebrew system all their own. The size of this unique segment would never be reflected in a regular sales chart, and we look forward to digging deeper with the Roll20 data to understand both this and other interesting trends in future Orr Reports.
OVERVIEW
Coming away from this Orr Report for Q2 2019, it would be easy to draw the conclusion that games in the classic fantasy genre dominate tabletop, but we think there’s much more going on here. While nearly two thirds of all Roll20 games are a version of Dungeons & Dragons or Pathfinder, the surprise surge of Call of Cthulhu calls attention to a growing segment of people who want to mix it up. Looking only at our top ten systems in these charts, at least 13% of players and 9.4% of campaigns have stepped into genres like horror, sci fi, and cyberpunk. We look forward to seeing these games continue to grow and expand on Roll20 in the future!
What other conclusions could you draw from the Q2 2019 Orr Group Industry Report? Here’s the full list:


